Good Morning
Today we’re looking at PayPal’s overlooked growth story, why Crocs is more profitable than luxury giant LVMH, Lululemon’s bad quarter (and the Sydney Sweeney factor), 8 simple profitability ratios every investor should know, and the 20 best-performing stocks since 2005.
This Week’s Top Stories
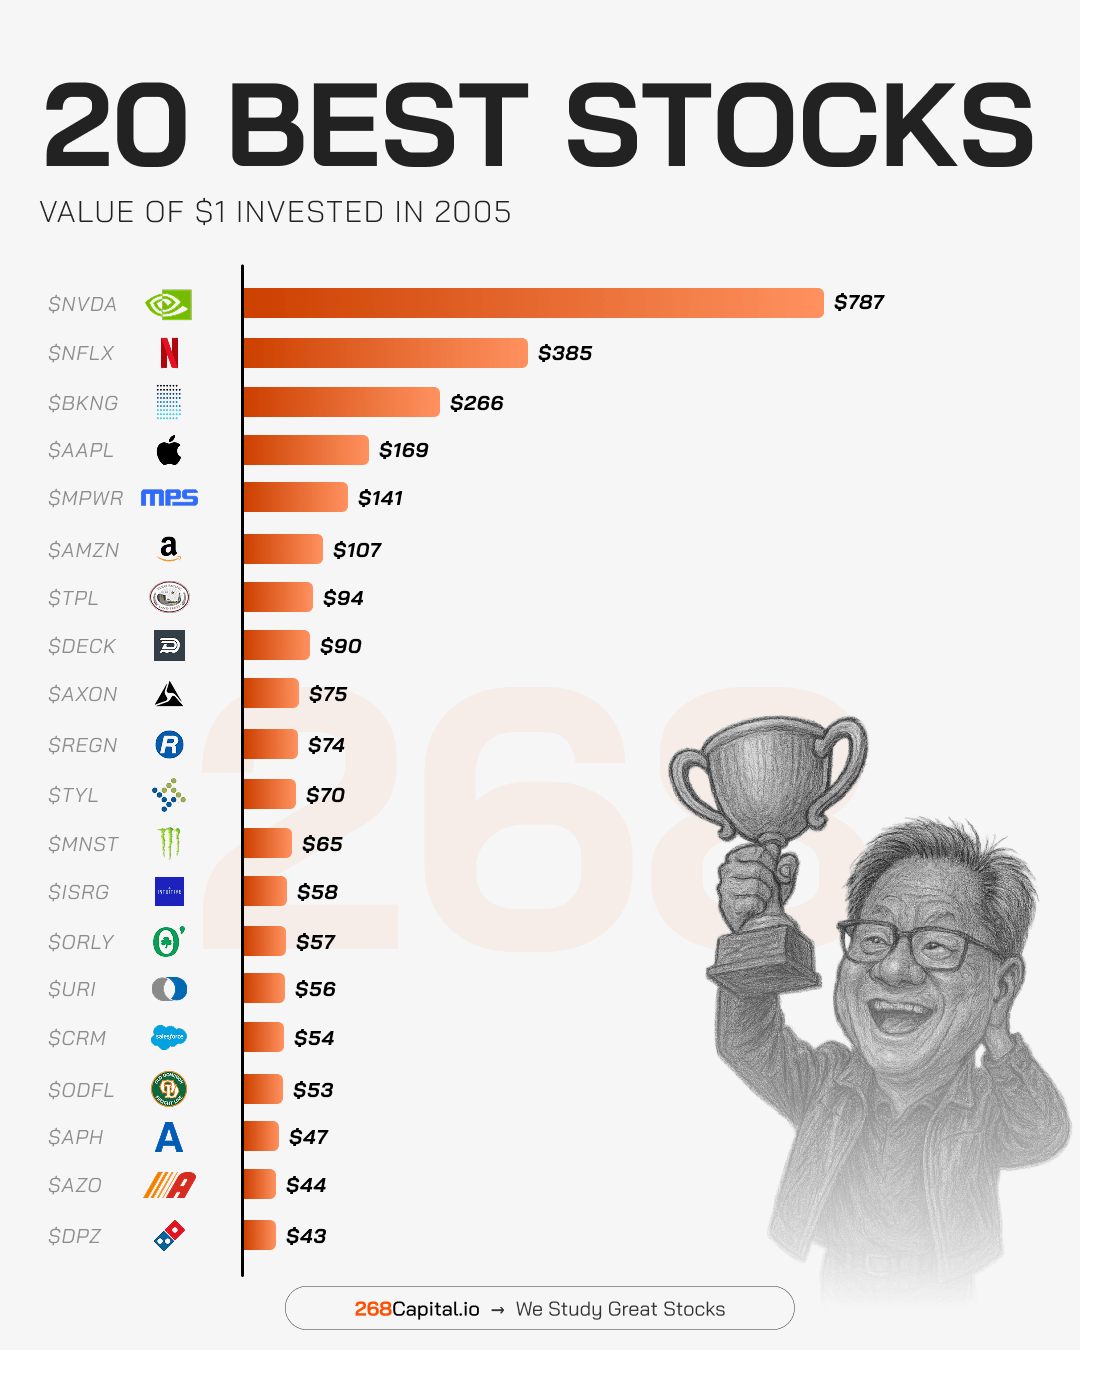
CHART OF THE WEEK
20 Best Stocks Since 2005
The past two decades created some of the biggest wealth engines in history. Here’s what $1 invested in 2005 would be worth today.
The leaderboard is clear—Nvidia dominates, turning $1 into a staggering $787, powered by the AI and chip revolution. Netflix sits in second at $385, proving how streaming reshaped entertainment. Booking Holdings ($266) and Apple ($169) show the power of long-term consumer trends. Even Amazon, often seen as a juggernaut, “only” returned $107 on that same $1. The lesson? Spotting transformational businesses early can deliver life-changing returns. But hindsight is always perfect.
STOCK IDEA VAULT
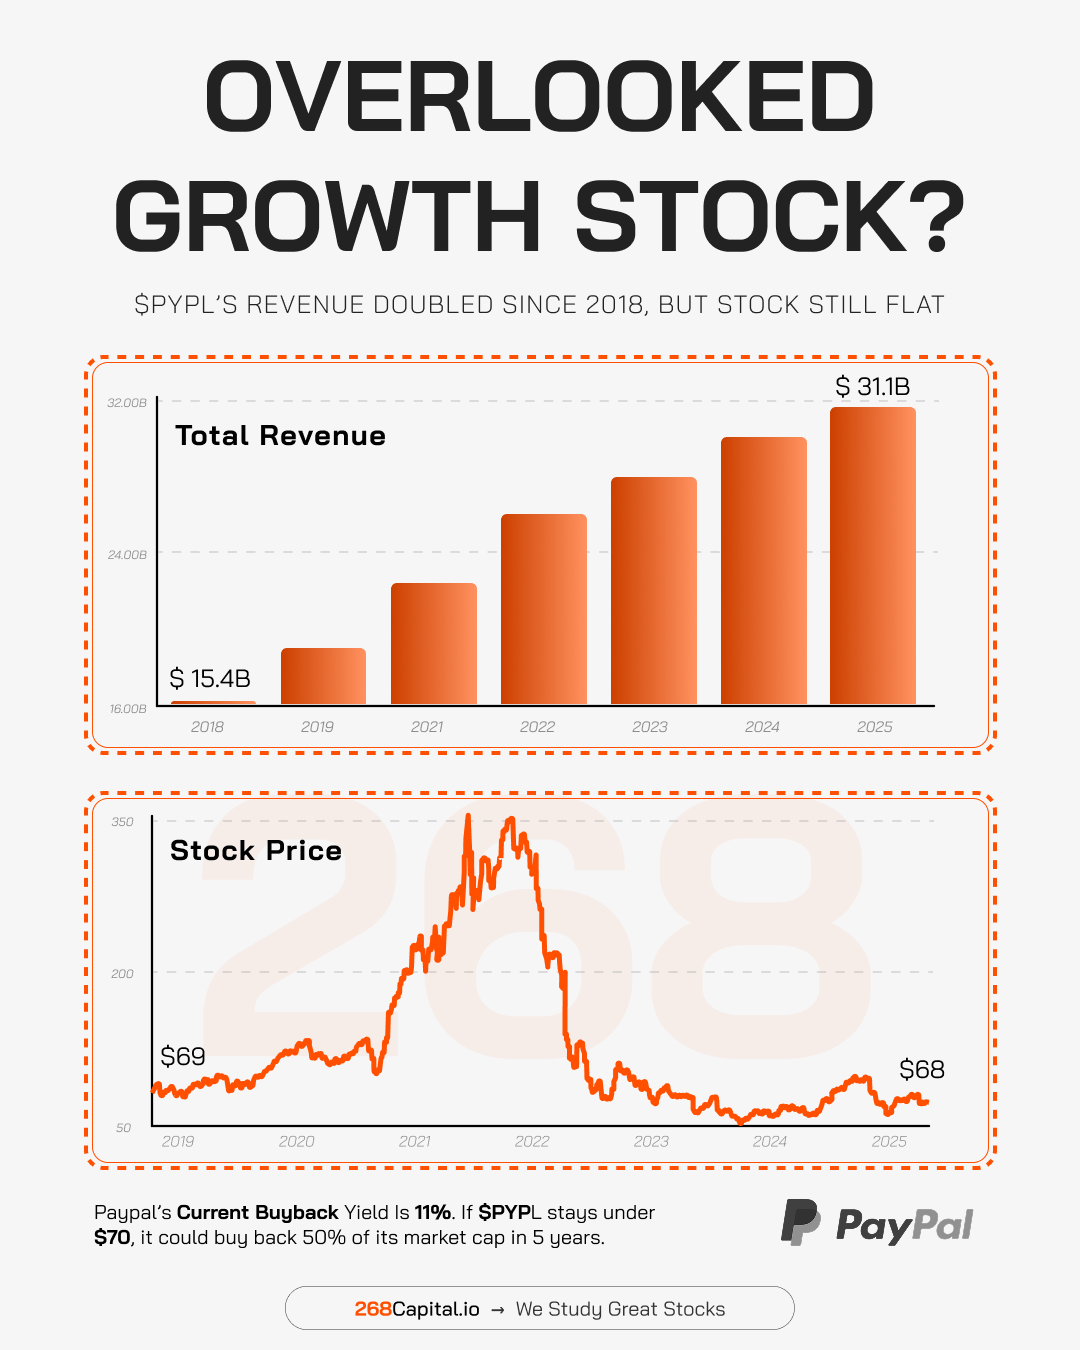
$PYPL Doubled Revenue, Stock Still Flat
PayPal’s revenue has surged from $15B in 2018 to $31B today—yet the stock trades near 2019 levels. Could Wall Street be missing something?
Since 2018, PayPal has quietly doubled its top line, hitting $31.1B in 2025. Despite that, the share price sits around $68, far from its 2021 highs above $300. One key detail: PayPal’s buyback yield is currently 11%. At this pace, the company could repurchase half its market cap in just five years—massively boosting per-share value if the stock stays low. Overlooked companies like this sometimes deliver long-term surprises.
268 STOCK RADAR
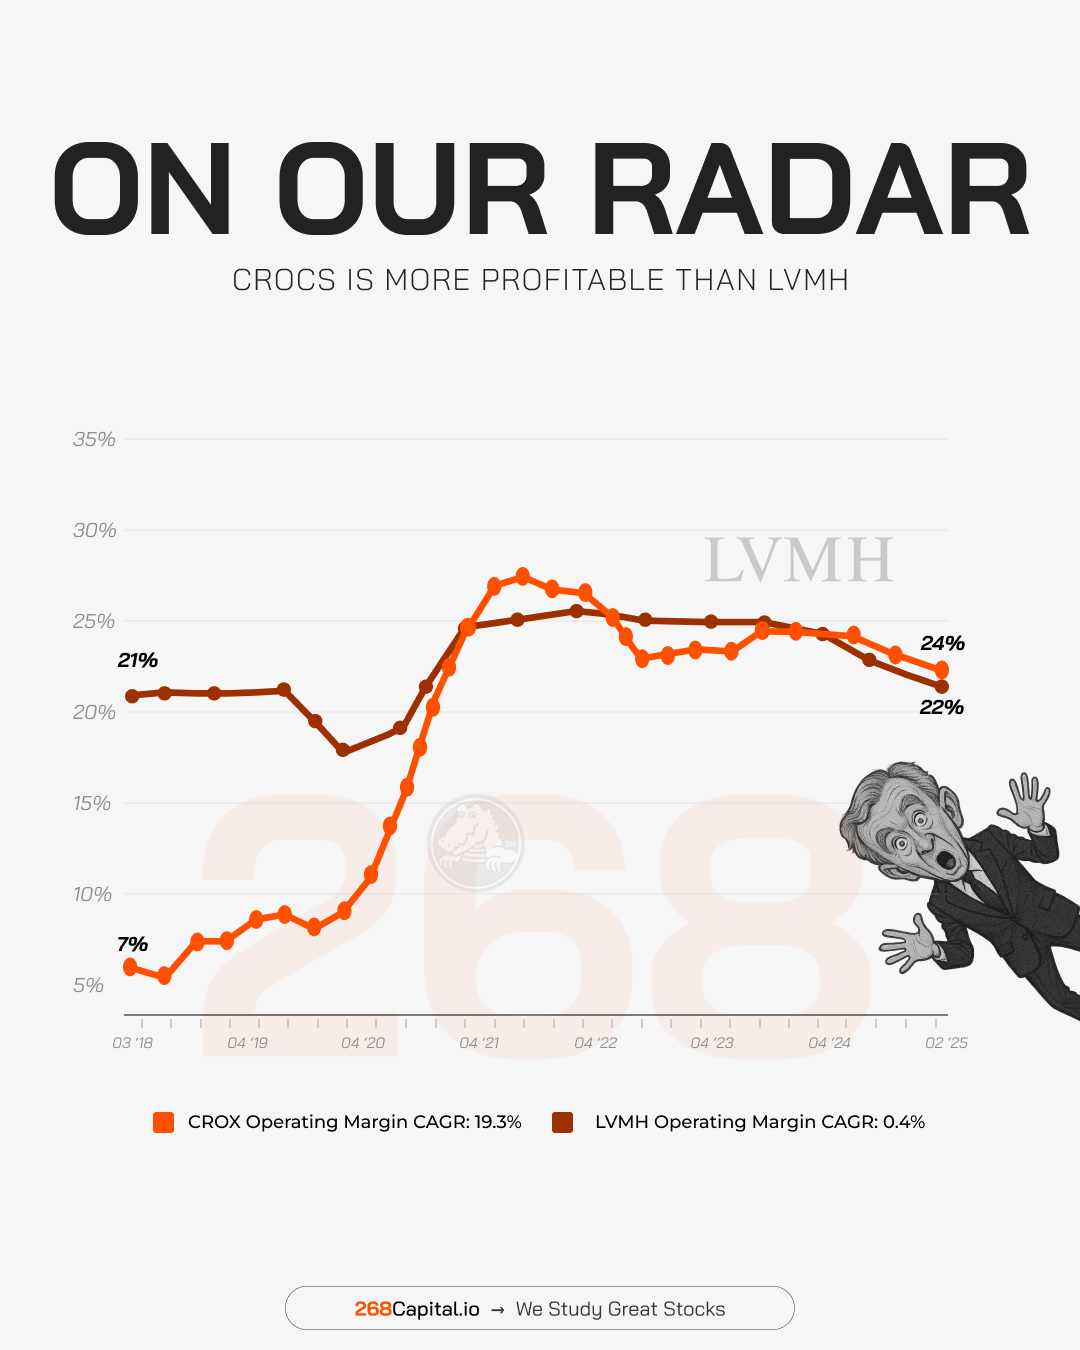
Crocs Beats Luxury Giant LVMH
Believe it or not—Crocs is running a more profitable business than the world’s biggest luxury empire. The margins tell the story.
Over the past few years, Crocs ($CROX) has quietly expanded its operating margins from just 7% in 2018 to 24% in 2025. That’s not just impressive—it actually surpasses LVMH, the global leader in luxury fashion and spirits, which sits at 22%. Crocs achieved a 19.3% CAGR in profitability, while LVMH barely moved at 0.4%. For a brand often dismissed as casual and quirky, these numbers show serious operational strength.
MARKET MADNESS
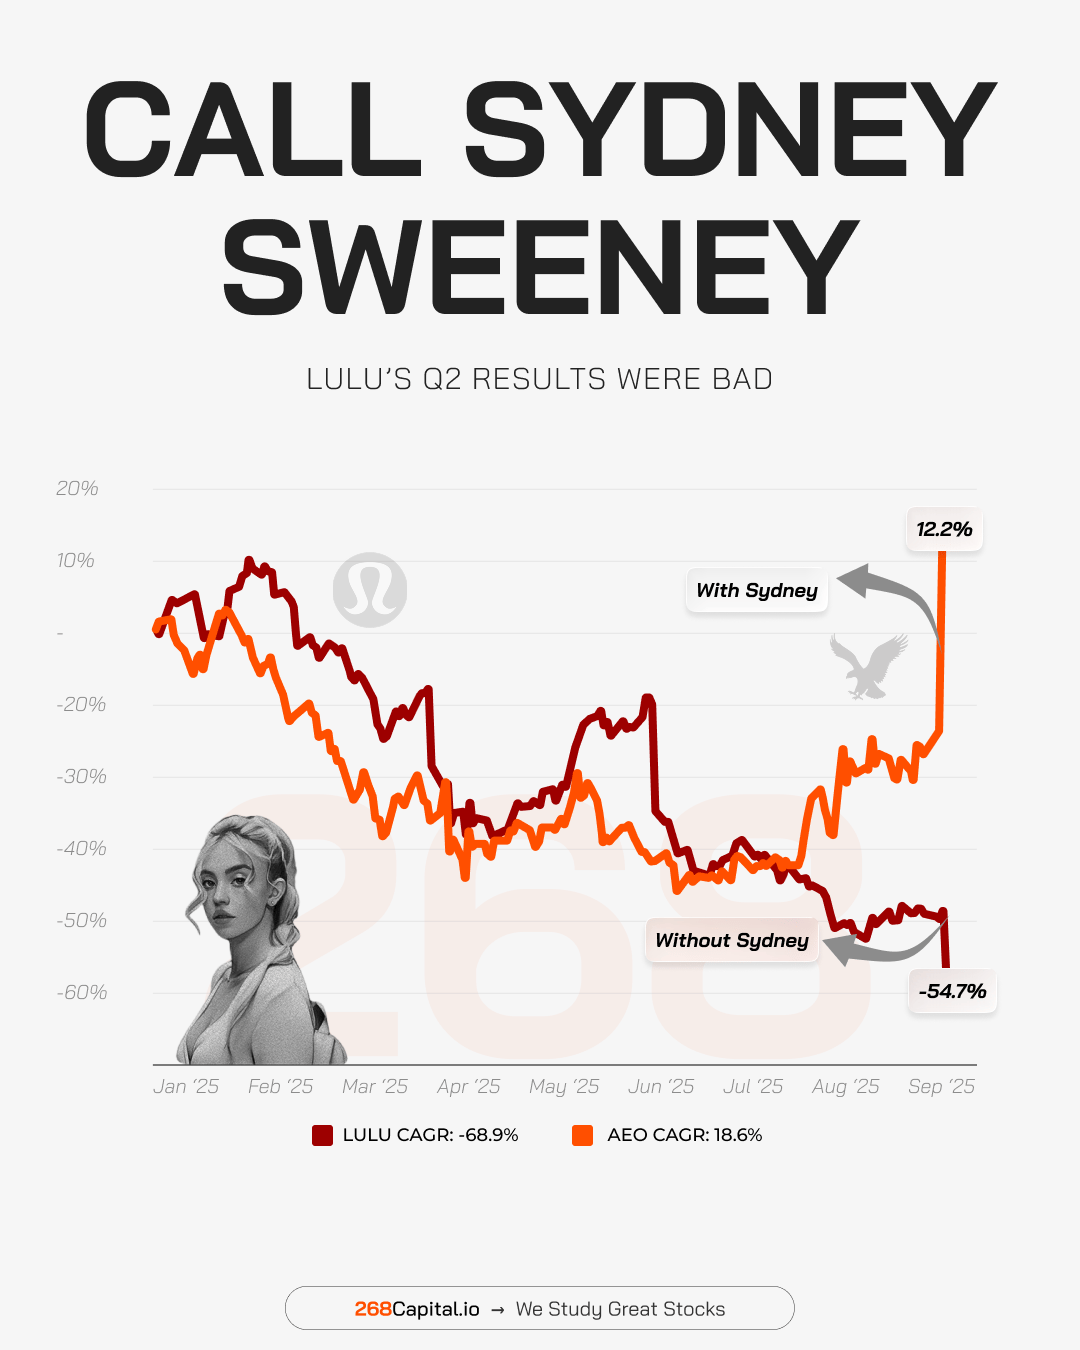
Someone Call Sydney Sweeney
While Lululemon stumbled with weak Q2 results, American Eagle tapped Sydney Sweeney—and the market reaction couldn’t be more different.
Lululemon ($LULU) has been on a painful slide in 2025, dropping over 54% year-to-date, with a brutal -68.9% CAGR. Meanwhile, American Eagle ($AEO), boosted by its Sydney Sweeney campaign, surged 12.2% and is compounding at +18.6%. The chart highlights the power of brand perception and marketing in retail. A single cultural connection can reignite momentum, while poor execution—even from a premium brand like Lululemon—can erase years of investor confidence.
LAWS OF INVESTING
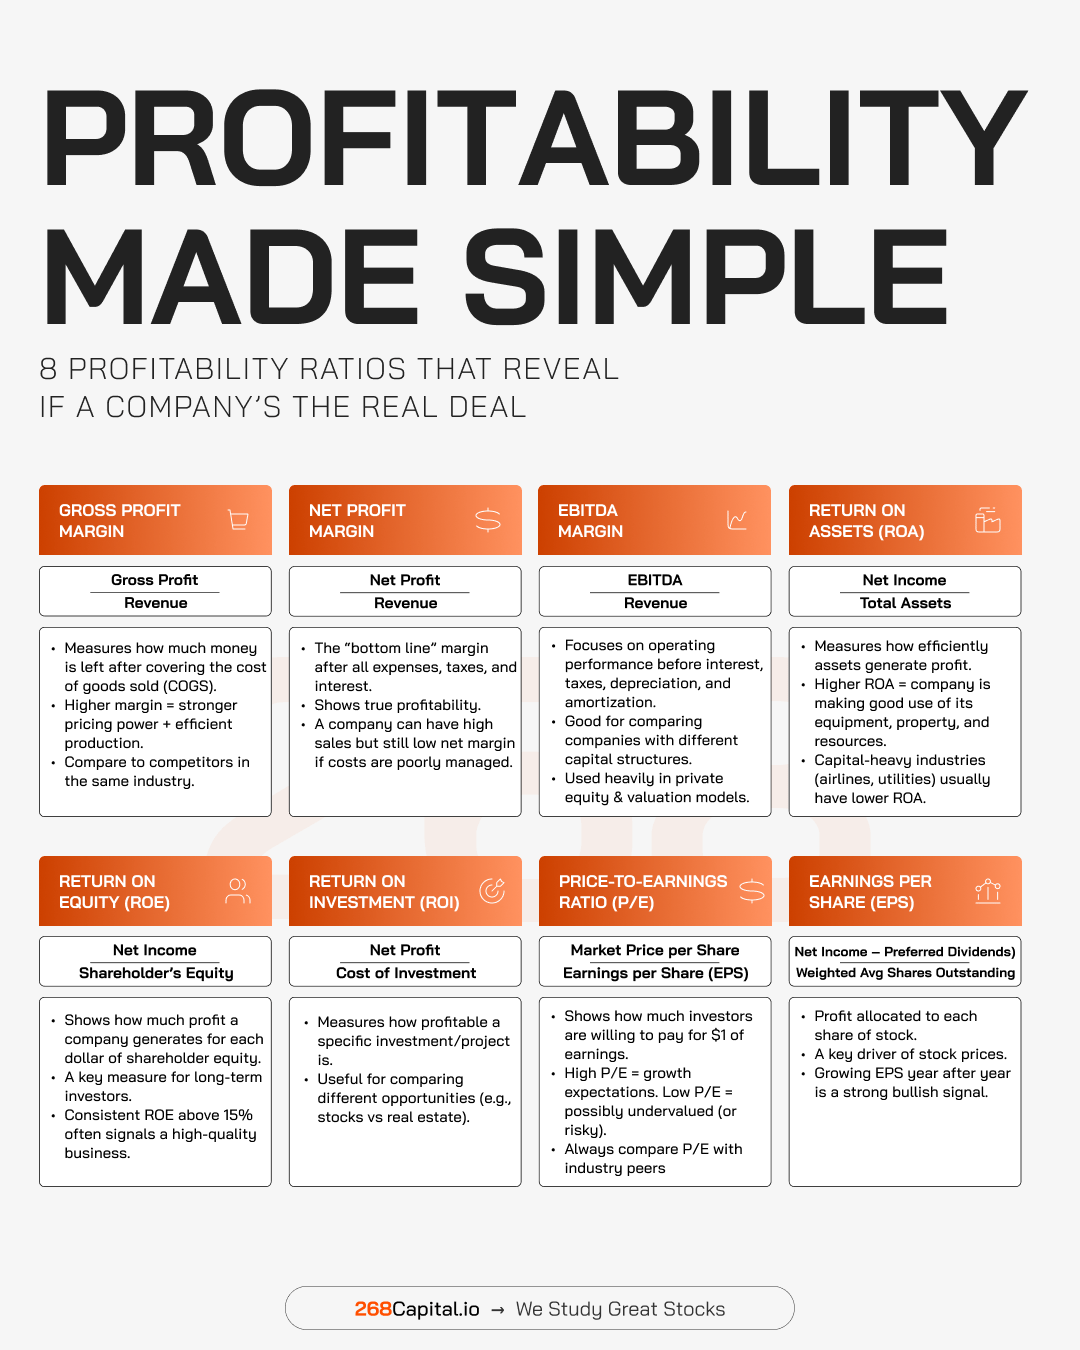
The Exclusive Profitability Cheatsheet
Want to know if a company is the real deal—or just hype? These profitability metrics cut straight to the truth behind the numbers.
Profitability is the heartbeat of any business, and these eight ratios reveal its strength. Gross Profit Margin shows pricing power and efficiency, while Net Profit Margin exposes the “bottom line” after all expenses. EBITDA Margin strips out accounting noise to show pure operating performance. Return on Assets (ROA) and Return on Equity (ROE) reveal how efficiently capital is being used, while Return on Investment (ROI) measures the profitability of specific projects. On the market side, the P/E ratio shows how much investors are willing to pay for earnings, and EPS growth tells you if the pie is getting bigger. Together, these ratios form a powerful lens—filtering hype from true wealth-building businesses.